
Chemicals Pricing Intelligence - Executive Summary
Chemicals pricing intelligence covers organic, inorganic, and specialty chemicals, with markets showing mixed but selective movements during August 2026. In organic chemicals, aromatics and olefins improved toward month-end, with benzene recovering strongly after an early decline as supply tightened; maintenance, lower imports, reduced port inventories, and logistics disruptions supported several aromatic commodities.
Tight benzene availability and maintenance also supported related intermediates, including MDI, although downstream buyers remained cautious, while China’s manufacturing activity stayed below par due to weak domestic industrial demand. Inorganic chemicals were relatively more stable, but sulphuric acid and other mineral acids weakened through August, while halogens, fluorochemicals, inorganic salts, alkalis, and bases also softened amid weaker downstream demand. Specialty chemicals showed narrower movements due to their application-specific demand patterns.
Key Price Developments & Insights
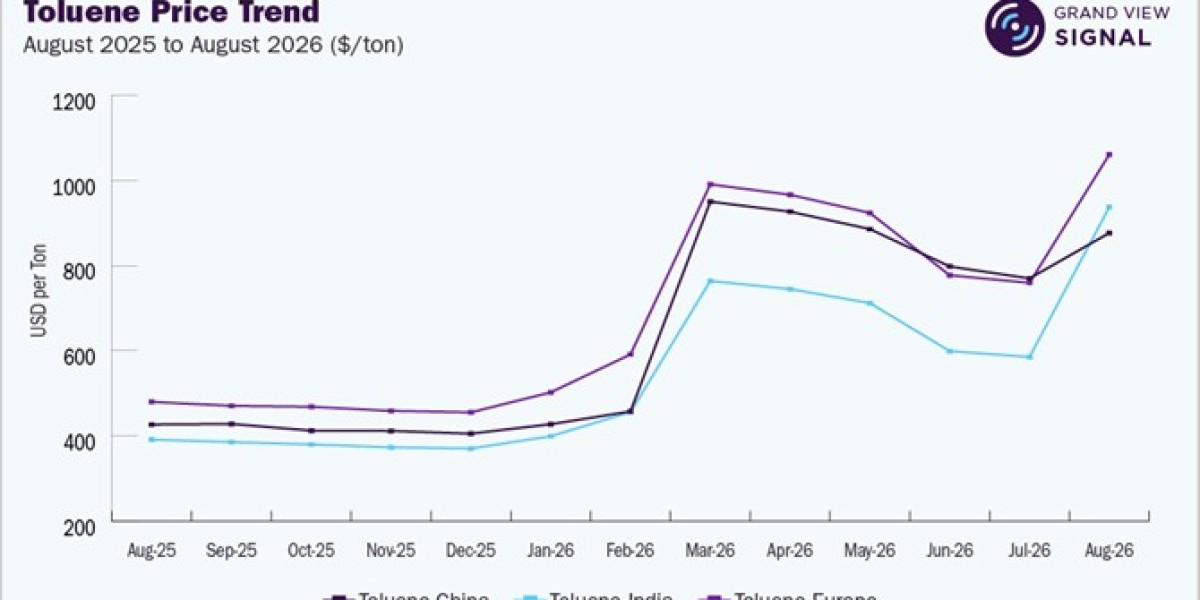
- Aromatics and intermediates: Benzene, Toluene, Phenol, and others recovered mid-month as tighter inventories and maintenance constrained supply, with Toluene surging across China, India, and Europe.
- Methanol: Methanol strengthened in China on tighter availability, while cautious buying in India, Europe, and Western markets kept local prices weak or stable.
- MDI: MDI gained temporary support from maintenance and higher benzene costs, especially in China, but weak downstream demand limited sustained gains.
- Inorganic chemicals: Most groups, including mineral acids, inorganic salts, alkalis & bases, and boron & silicon compounds, remained restricted or weakened during August 2026.
- Supply-chain conditions: Regional logistics continued adjusting to Middle East routing risks, including efforts to develop alternative routes bypassing the Strait of Hormuz.
Top Performing Chemicals Commodity
- Top Mover: Toluene
- Average MoM Growth (top 3 geographies): 37.9%
- Volatility Level: High
Schedule a free demo of Grand View Signal to get real-time preview of price fluctuations in the Chemicals Sector
Chemicals Sector Coverage and Key Price Influencers
1. Organic Chemicals
The organic chemicals category includes alcohols and glycols, amines and nitrogenous organics, aromatics and olefins, monomers and resin intermediates, organic acids and anhydrides, plasticizers and phthalates, as well as solvents, ketones, and esters. During August 2026, pricing movements were mixed but generally firmer across several key chains. Benzene, methanol, and selected downstream intermediates recovered from early-month weakness, supported by maintenance activity, tighter inventories, and reduced import availability. However, weak downstream margins limited the extent and consistency of the recovery.
Key Pricing Influencers:
- Crude oil, naphtha, benzene, propylene, and methanol costs
- Plant maintenance, operating rates, and inventory availability
- Import arrivals and regional logistics
- Demand from plastics, resins, coatings, textiles, and pharmaceuticals
- Downstream margins and inventory-management decisions
2. Inorganic Chemicals
The inorganic chemicals category includes alkalis and bases, halogens and fluorochemicals, industrial minerals and fillers, inorganic salts, mineral acids, and sulfur and carbon products. Market conditions remained mixed during August, with mineral acids performing relatively weaker than other groups due to slightly lower demand and cautious government policies aimed at maintaining stable domestic inventory levels.
Key Pricing Influencers:
- Sulphur, salt, phosphate rock, fluorspar, energy, and mineral costs
- Chlor-alkali, acid, and ammonia operating rates
- Demand from alumina, glass, fertilizers, mining, and water treatment
- Inventory availability and regional production changes
- Chemical shipping flows
3. Specialty Chemicals
The specialty chemicals category includes oxidants and persulphates, covering ammonium persulfate, sodium persulfate, sodium hypochlorite, and hydrogen peroxide. Prices remained relatively stable during August, as consumption was largely driven by specific industrial applications rather than high-volume feedstock trading.
Key Pricing Influencers:
- Water-treatment and disinfection requirements
- Polymerization and resin-production activity
- Electronics, textiles, and metal-processing demand
- Electricity and raw material costs
Get historical, current, and forecast chemicals price assessments. Request Free Access to Grand View Signal
Pricing Trends, August 2026
- Organic Chemicals
Organic chemicals showed mixed movement during August 2026, with benzene, toluene, and selected aromatics recovering as domestic producers adjusted prices. In India, BPCL increased local toluene prices, while China’s Shandong prices rose nearly 5% week-on-week from August 17 to 24. Methanol also strengthened toward month-end as Strait of Hormuz disruptions and the Middle East conflict constrained normal trade flows, while recovering consumption, particularly for gasoline additives, outpaced incoming supply and supported prices.
- Inorganic Chemicals
Inorganic chemical markets remained stable to weak during August 2026, with sulphuric acid prices in China staying under pressure. Local copper smelters reduced sulphuric acid prices by nearly USD 8/ton, while a major producer scheduled maintenance on its largest production lines from August 20 for 35 days, temporarily removing around 50,000 tons of supply. This supply reduction could support sulphuric acid prices in the following month.
- Specialty Chemicals
Specialty chemicals remained relatively stable during August 2026, with sodium hypochlorite, sodium persulfate, and ammonium persulfate trading within narrow ranges as procurement was driven by immediate demand from water treatment, disinfection, textile, and metal-processing applications. These products were less affected by the feedstock and supply-driven fluctuations seen in major organic chemical chains.
Access commodity-wise monthly forecast datasets for the next 6 months. Request Free Access to Grand View Signal
Chemicals Key Market Drivers
- Feedstock volatility and Middle East disruptions: Crude, naphtha, and hydrocarbon feedstocks remained key cost drivers as conflict-related disruptions around the Strait of Hormuz affected vessel movements, encouraged alternative sourcing, and weakened sentiment, particularly for organic chemicals such as methanol and ethylene glycol.
- Chinese plant maintenance: Plant maintenance tightened physical availability and supported prices. Wanhua Chemical’s Yantai MDI facility, with 1.1 million tons/year capacity, began a 45-day maintenance period from August 10, prompting buyers to secure supply and supporting MDI prices by month-end.
- Tight methanol availability: Methanol prices strengthened as imports, domestic production, and port arrivals declined amid Middle East disruptions, tightening inventories and increasing buying interest, particularly across Asian markets.
- Weak downstream demand and margins: Softer downstream demand limited a broader chemicals rally. China’s manufacturing PMI improved slightly by 0.6 points, but weak margins kept buyers cautious for products such as MDI and toluene, while European producers faced low utilization and high operating costs.
- Trade policy and regional investment: Governments and producers focused on regional supply security, with India advancing chemical and petrochemical investment initiatives, Egypt expanding phosphate and fertilizer capacity around the Suez Canal, and U.S.–Canada trade tensions adding uncertainty to North American chemical supply chains.
Get detailed driver impact analysis on Chemical Prices. Request Free Access to Grand View Signal
Grand View Signal offers
Grand View Signal tracks 200 commodities across multi-countries and reconstructs the price history back to 2016. This way, decision-makers can see not just what a material costs, but the drivers impacting the same. The offering includes commodity price capture across 8 sectors.
- Weekly Commodity Pulse - What changed across commodity markets this week - the panoramic view, in five minutes.
- Why Prices Moved - A single commodity, taken apart. Every driver, ranked, with the causal chain traced.
- Risk Watch - What could disrupt supply in the next four to eight weeks, with exposure graded.
- Decision Brief - The stance, the triggers that would change it, and the six-month forecast.
Read our latest articles on
- What Is Commodity Price Intelligence? A Definitive Guide
- Mastering EU PPWR Sourcing Through Commodity Price Intelligence
- Top 5 Factors That Cause Raw Material Price Spikes (And How to Prepare)
- How Steel Scrap Prices Are Reshaping the Decarbonization Agenda for Steelmakers
- Managing Commodity Price Volatility in 2026: The Strategic Procurement Imperative
- Commodity Price Intelligence vs. Price Indices: What’s the Difference?
- Iron Ore Prices in 2026: What's Driving the Volatility?
- Signal vs. Bloomberg Terminal for Commodity Price Data: A Practical Comparison
- India's Steel Boom: What It Means for Global Iron Ore and Scrap Demand
- Iron Ore Price vs. Steel Price: Why They Don't Always Move Together