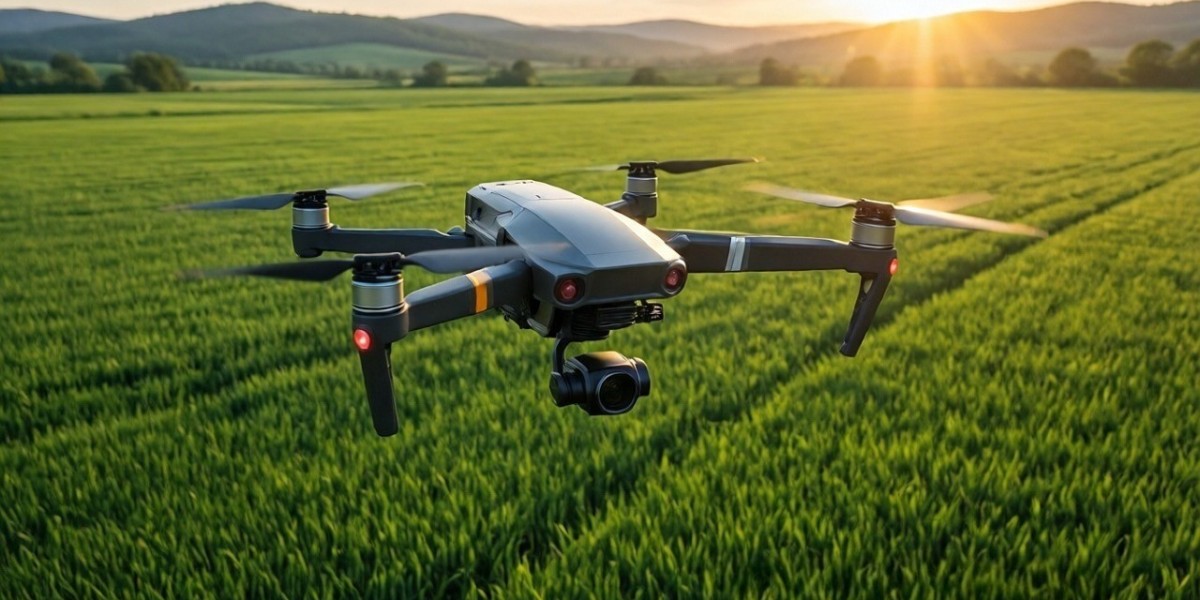

Agricultural drone mapping helps farmers see how a field differs from one area to the next. A drone captures overlapping images, software turns them into georeferenced maps, and the farmer uses those maps to decide where to look first. Cloud processing means no GPU workstation.
This guide explains what field variability is, how drone maps show it, and how providers can turn it into deliverables clients use.
Ready to map your first field? Start with Aeroyantra’s agriculture workflow.
What Field Variability Is and Why It Matters
No field is uniform. Soil type, slope, drainage, compaction, planting depth, and past field work all change from one part of a field to another. Crops respond to those differences, so growth is rarely even.
A farmer walking the rows sees a small slice of the field at ground level. A map shows the whole field at once, so patterns that are hard to spot on foot become clear.
Variability matters because it points to where money and time are going. A low spot that holds water, a compacted headland, or a stretch of thin stand can each cost yield. Finding them early gives the client a chance to act.
How Agricultural Drone Mapping Works
Agricultural drone mapping starts with a flight plan over the field. The drone captures hundreds of overlapping photos, each tagged with its position. Photogrammetry software matches features across the photos and calculates position and elevation for every part of the map.
The result is a set of georeferenced outputs. Each one is measurable, so the client can check an acre count, trace a low area, or compare two dates.
Drone agriculture mapping gives a snapshot of the surface the camera sees. It does not explain why a pattern exists. The cause could be water, pests, nutrients, compaction, or equipment, and someone on the ground still has to confirm it.
Monitoring Crop Health With Drone Maps
Crop health monitoring depends on comparison. One map is a snapshot. A series of maps shows where a problem began and whether it is spreading.
What an RGB map shows
A standard RGB camera produces a true-color map. It reveals visible patterns such as:
- Bare patches and stand gaps
- Uneven emergence
- Standing water and wet areas
- Color differences within a crop
- Wheel tracks and equipment damage
What multispectral adds
Vegetation indices such as NDVI need a multispectral sensor that records light outside the visible range. If you plan to sell index-based maps, confirm that your processing platform accepts your sensor and its file format before you quote the job. Follow the sensor manufacturer’s guidance on calibration for each flight.
A practical monitoring routine
- Fly a baseline. Map the field early in the season under steady light.
- Repeat on an agreed schedule. Many providers fly at key growth stages, adjusted for the crop and the client.
- Compare dates. Look for areas that differ from the rest of the field or that changed since the last visit.
- Flag and walk the areas. The map says where to look. A person on the ground finds the cause.
Mapping Elevation, Drainage, and Boundaries
Crop health is only one use. Many farm clients also want elevation and drainage data, and these jobs make good steady work for providers.
- Elevation and slope: a surface model shows how the ground rises and falls.
- Drainage: low spots, ponding areas, and the direction water moves.
- Field boundaries and acreage: a current map confirms field edges and counts acres for leases, sales, or program paperwork.
- Land improvement documentation: before and after maps of grading, terracing, or tile installation.
For elevation work, map bare ground or early growth when you can. Tall, dense crops hide the ground, so the surface model shows the canopy instead. For bare-earth terrain under heavy cover, LiDAR may be the better data source.
How Farmers Use the Maps
Farmers rarely ask for a map for its own sake. They ask for an answer. Here is how the same data supports different decisions.
- Scouting: the map tells the farmer which areas to walk first, which saves time across large acreage.
- Drainage planning: elevation and low spot maps support tile and ditch decisions.
- Stand evaluation: gaps and uneven emergence help the farmer judge a planting.
- Record keeping: dated maps document field conditions and work completed.
- Conversations with agronomists: a shared map makes discussions about specific areas easier.
Management zones and variable rate plans are usually built in farm management or GIS software. Your maps can feed that work, so ask the client which formats their software accepts.
Data Capture Tips for Field Mapping
Good processing starts with good capture. A few settings matter more than the rest.
Overlap
A common starting point is about 75 percent front overlap and 70 percent side overlap. Uniform crops such as corn, wheat, and soybeans give software few distinct features to match, so many pilots raise overlap over those fields. Run a short test flight and review it before you commit to a large field.
Flight height
Many field mapping flights fall between 200 and 400 feet above ground level. Lower altitudes give finer detail but need more images and more flight time. In the US, Part 107 rules generally cap flights at 400 feet above ground level, so confirm current FAA requirements for your operation.
Ground control points and RTK or PPK
If the client will rely on elevation, add ground control points near the field edges and a few across the interior. If your drone supports RTK or PPK, you may need fewer points. Many providers still survey a few independent checkpoints that they do not use in processing, so they can test accuracy.
Keep repeat flights consistent
- Fly in steady light and at a similar time of day on each visit.
- Keep the same flight plan, height, overlap, and sensor settings all season.
- Avoid high wind, which can hurt image alignment.
- Check a few images on site before you leave.
Deliverables for Farm Clients
Clients want something they can read, share, and act on, not raw files.
- Orthomosaic: a georeferenced, measurable image of the whole field
- Vegetation index map: only when you flew a multispectral sensor and your platform supports it
- Elevation model and contours: for drainage and grading discussions
- Field boundary file: for acreage and GIS use
- Flagged area list: locations and dates for the client to check on foot
- Point cloud: useful for detailed terrain review
Ask early whether the client uses GIS software, a farm management platform, or only needs a PDF map.
Workflow: From Upload to Export
Cloud processing keeps the workflow short.
- Capture. Fly the field with the overlap and height settings above. Survey control points if the job requires them.
- Upload. Add the image set to a project from any computer with an internet connection. Name projects by field and date.
- Add control data. Include ground control points or RTK or PPK data before you process so they affect the result.
- Process. The platform runs photogrammetry on remote servers, so you do not need a high-end GPU or a dedicated processing machine. See the cloud processing features for supported outputs.
- Review. Check the orthomosaic for gaps, blur, and stitching errors.
- Export. Download the outputs your client asked for.
A common mistake is skipping the review step. Catching a gap while you are still near the field is much cheaper than a return trip.
Common Mistakes to Avoid
- Changing settings between flights: maps from different dates become hard to compare.
- Skipping the test flight: uniform crops can fail to match, and you find out after you leave.
- Mapping tall crops for elevation: the surface model shows the canopy, not the ground.
- Treating every color difference as a problem: soil type, planting date, and lighting all change how a map looks.
- Quoting index maps without the right sensor: vegetation indices need multispectral data.
- Promising a diagnosis: maps show where to look. They do not tell the client why.
Calculating Cost per Acre
Cost per acre makes processing options comparable, and it matters most for repeat monitoring, where one field is processed many times in a season.
- Cost per acre = total processing cost for the period divided by acres processed in that period.
Inputs to include:
- Your monthly or per-project processing charge
- Total acres processed, counting every repeat flight
- Extra storage or add-on charges
- Hardware costs, if you process on your own machines
Here is the acreage arithmetic. An 80-acre field flown eight times in a season counts as 640 acres processed. A client with five such fields counts as 3,200 acres. Run the math on your real flight schedule, and check current rates on the Aeroyantra pricing page.
Flying and travel costs are separate from processing, so track them too.
Choosing Software for Agricultural Drone Mapping
Providers compare tools such as Pix4D, DroneDeploy, Agisoft Metashape, Propeller, Bentley, and WebODM. Each has real strengths, and the right pick depends on your work and your clients.
Use these criteria:
- Cost per acre: calculate it on your actual seasonal volume
- Turnaround: how long you wait from upload to usable output
- Accuracy: how well results hold up against your checkpoints
- Hardware: whether you need a GPU workstation or can process in the cloud
- Sensor support: whether your RGB or multispectral data is accepted
- Outputs: whether the formats match your client deliverables
- Support: how quickly you can get help during a busy season
Test any tool on a field you already know. Compare its output against your checkpoints rather than relying on a marketing claim.
Who should not choose Aeroyantra
If you want fully offline processing, or you already own a powerful workstation and prefer desktop control, a desktop tool may suit you better. If your work depends on a sensor type or index output that a platform does not list, confirm support first.
Aeroyantra is built for providers who want cloud processing without GPU hardware and a self-serve way to get maps out the door.
Start Mapping Field Variability in the Cloud
Farmers get the most from agricultural drone mapping when flights are consistent and maps arrive predictably. Fly the same plan each time, process in the cloud, and deliver maps that show clients where to look first.
Create your account and process your first agriculture project with Aeroyantra.
Frequently Asked Questions
What is agricultural drone mapping?
Agricultural drone mapping means flying a drone over fields, capturing overlapping images, and processing them into georeferenced maps. Common outputs include orthomosaics, elevation models, contours, and field boundaries. Farmers and service providers use them to review crop condition, drainage, and acreage, and to compare field conditions from one visit to the next.
How does drone mapping show field variability?
Maps show the whole field at once, so differences in growth, color, elevation, and wetness become visible patterns. Soil, slope, drainage, and compaction all vary across a field. A map points to where conditions differ. Someone on the ground still has to confirm the cause of each pattern.
Can an RGB camera monitor crop health?
An RGB camera can show visible patterns such as bare patches, uneven stands, and standing water. It cannot produce vegetation indices like NDVI, which need a multispectral sensor. Either way, the map shows where to look, and a person on the ground confirms what is causing the pattern.
How often should I fly a field?
There is no single schedule. Many providers fly at key growth stages and adjust for the crop, the client, and the weather. Agree on a schedule before the season starts, and keep the same flight plan and sensor settings so each map can be compared with the last.
Do I need a GPU computer to process agricultural drone maps?
Not with cloud processing. Desktop photogrammetry tools often benefit from a powerful GPU and plenty of memory, while a cloud platform runs the heavy work on remote servers. You upload images from any computer with an internet connection and download the finished outputs when processing completes.